RESEARCH:
Earth system modeling, global climate change, solar geoengineering, radiative forcing and feedbacks, global carbon and biogeochemical cycles, climatic effects of land cover and land use change, impacts of climate change on forestry and water resources, global water cycle and regional monsoon systems.
Some recent research from Prof. Bala’s group is discussed below.
1. Climate System Feedbacks
An understanding of the climate response to different radiative forcing agents is fundamental for climate change studies. At the Indian Institute of Science, Bengaluru, India, we use comprehensive coupled climate models to understand the climate response, especially the feedbacks and efficacies, to various forcing agents (e.g., carbon dioxide, solar irradiance, methane, black carbon and sulphate aerosols). Efficacy refers to the effectiveness of a forcing agent, relative to CO2, in changing the global mean surface temperature per unit top of the atmosphere radiative forcing. Our goal is to provide a mechanistic explanation for the dependence of feedback and efficacy on the forcing agents. We use the radiative kernel technique and primarily focus on the Planck, water vapor, albedo, lapse rate and cloud feedbacks which determine the climate response on multi-decadal timescales
(Figure 1). Besides feedbacks and efficacies, we also estimate other related metrics such as the radiative forcing, hydrological sensitivity and climate sensitivity. Our calculations are mainly based on climate model simulations performed using the NCAR CESM framework on the supercomputers at the Indian Institute of Science.
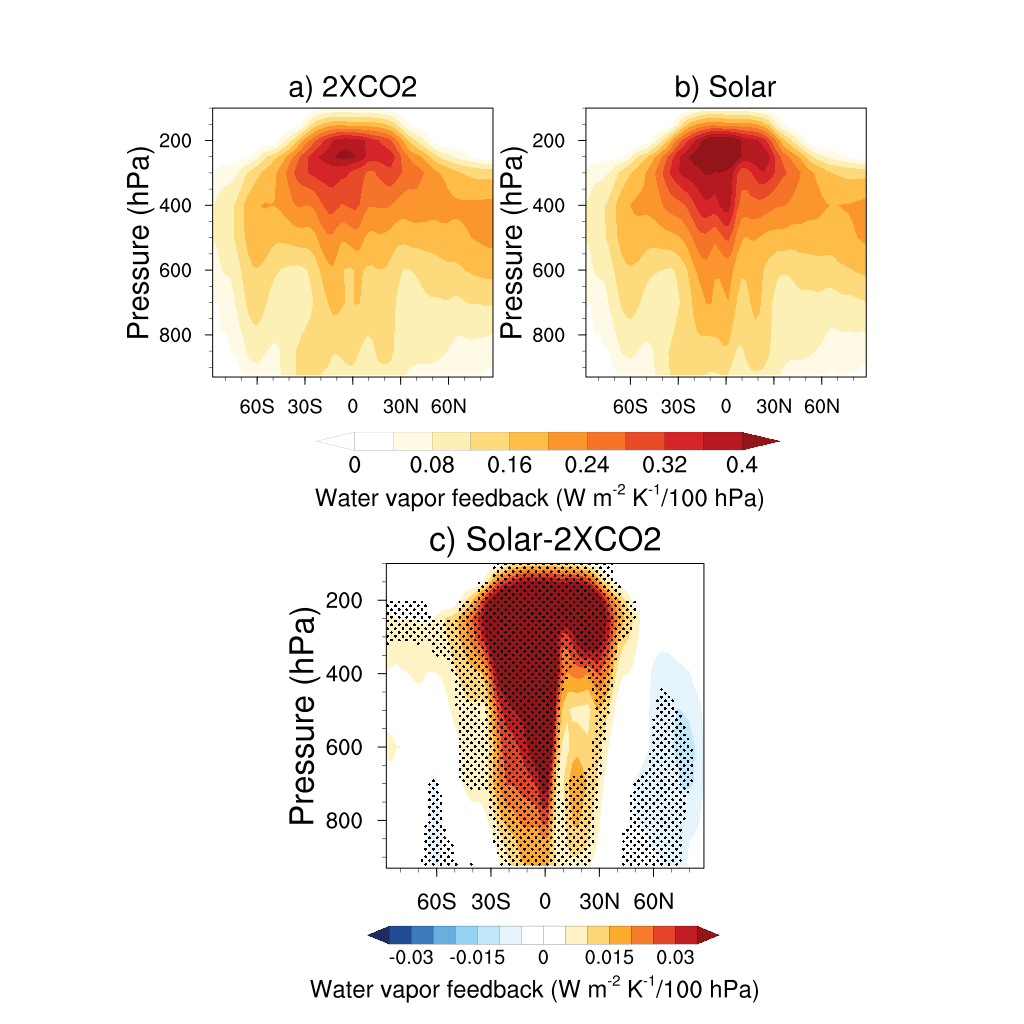
In a recent study (2023), we found that solar forcing is less effective than CO2 forcing for the same imposed radiative forcing: the net feedback estimated for CO2 and solar radiative forcing from our model simulations is -1.23 W m-2 K-1 and -1.45 W m-2 K-1, respectively. Our analysis based on the radiative kernel technique showed that the difference in feedback between the two cases is primarily due to differences in lapse rate, water vapor, and cloud feedbacks, The differences in feedbacks arise mainly from differences in the latitudinal structure of forcing and the consequent warming.
Publication:
Harpreet Kaur,
G. Bala and Ashwin Seshadri, 2023: Why is Climate Sensitivity for Solar Forcing Smaller than for an Equivalent CO2 Forcing? Journal of Climate, DOI: 10.1175/JCLI-D-21-0980.1
Figure 1 (A comparison of water vapor feedback for CO2 and Solar forcing) The zonal water vapor feedback (W m-2 K-1/100 hPa) for a) CO2 radiative forcing (2XCO2), b) solar radiative forcing (Solar) and c) the difference between the two (Solar minus 2XCO2) calculated using the radiative kernel technique. It can be clearly seen from panel c) that the water vapor is stronger in the tropical upper atmosphere but weaker in the polar regions for solar radiative forcing compared to CO2 radiative forcing
2. Solar geoengineering
Solar geoengineering refers to recent proposals of intentional planetary scale intervention options that would increase the amount of solar radiation reflected by our planet to ameliorate the detrimental impacts of climate change. Deliberate injection of sulphate aerosols into the stratosphere is one of the several solar geoengineering approaches. In this approach, the aerosols injected into the stratosphere such as sulphates would reflect more incoming solar radiation. The consequent reduction in solar radiation at earth’s surface leads to cooling which would and partially or fully offset global warming. At the Indian Institute of Science, Bengaluru, India, we study the impacts of different design strategies of injecting sulphate aerosols into the stratosphere on the Indian Monsoon rainfall.
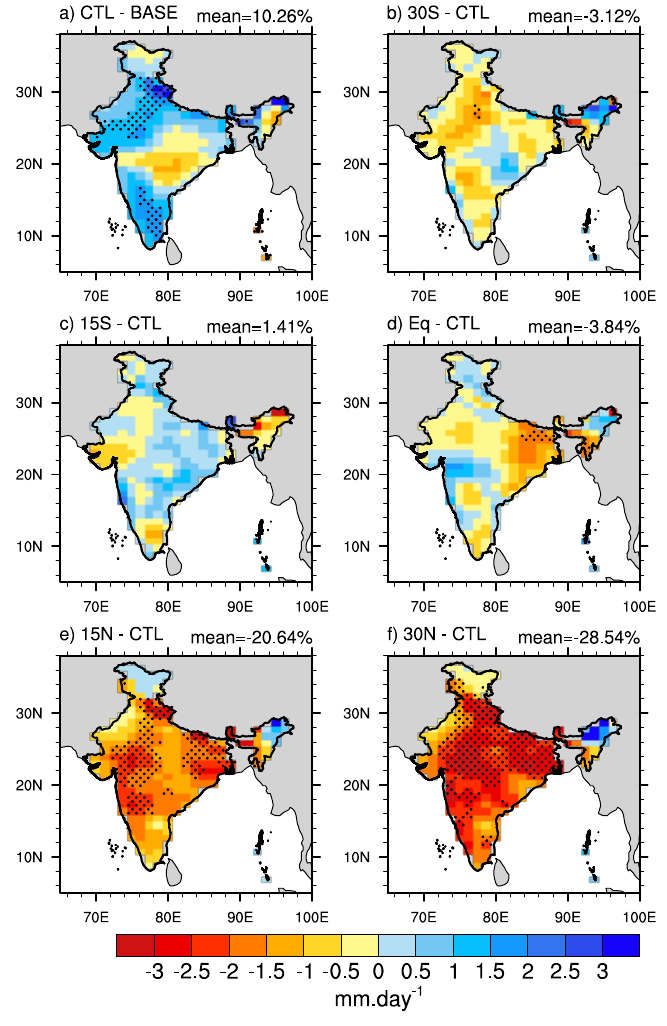
In a recent research work (2022), we studied the impact of varying the latitudinal position of aerosol injection on the global monsoon precipitation in a climate change scenario (RCP8.5) by analyzing single point injection simulations where 12 tera gram (Tg) of sulfur dioxide (SO2) are injected each year into the stratosphere at latitudes 30°S, 15°S, equator, 15°N, and 30°N. During the period 2043-2049, relative to the climate change scenario, the hemispheric mean summer monsoon precipitation decreases in the hemisphere where aerosols are injected but increases in the opposite hemisphere. The changes in precipitation are linked to the changes in interhemispheric temperature difference and shifts in the intertropical convergence zone. The summer monsoon precipitation over India decreases by about 21% for 15°N and 29% for 30°N injections (Figure 2). Our study highlighted the likelihood of poorly designed climate interventions leading to large regional disruptions while attempting to keep the global mean climate change within a safe limit.
Publication:
Krishnamohan, KS, G. Bala, 2022: Sensitivity of tropical monsoon precipitation to the latitude of stratospheric aerosol injections, Climate Dynamics,
https://doi.org/10.1007/s00382-021-06121-z
Figure 2 (Sensitivity of Indian monsoon rainfall to the latitude of stratospheric aerosol injection) The spatial pattern of June to September (JJAS) precipitation change over the Indian region in CTL (2043-2049) relative to the BASE period (2010-2030) and in the single point SO2 injection experiments relative to the CTL simulation during 2043-2049. Percentage changes in the mean over the region is shown in the top right of each panel. The stippling in the panels shows the regions where the changes are significant at the 5% significance level.
3. Monsoon low pressure systems (LPS) over India
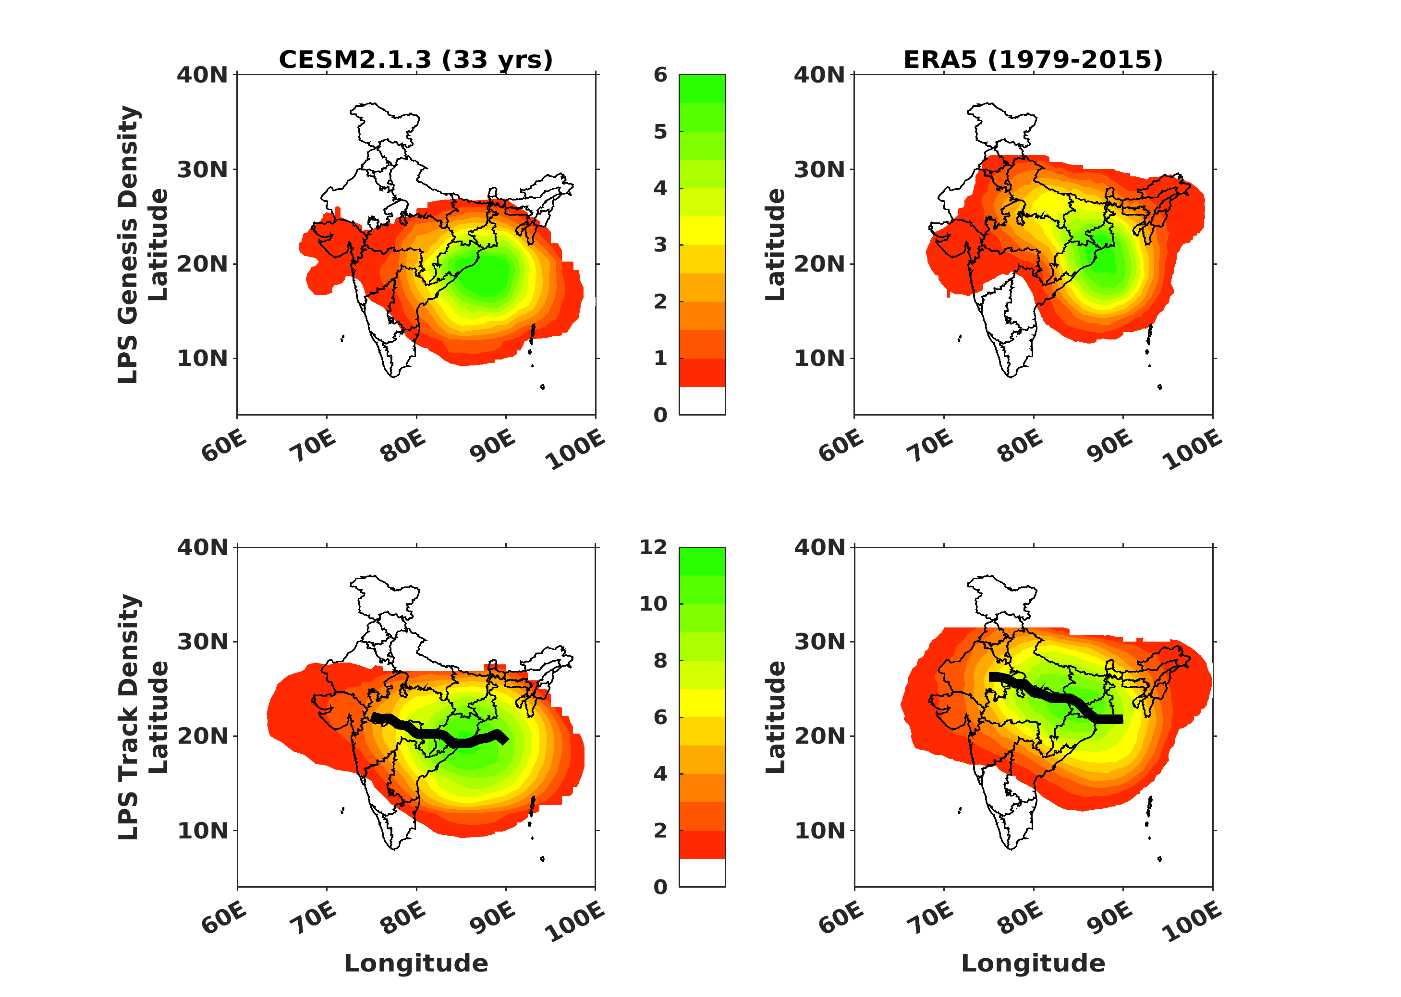
One of the striking features of the Indian summer monsoon is the synoptic scale cyclonic disturbances that periodically pass over the monsoon core region (central India), the monsoon low pressure systems (LPS). A significant part of monsoon precipitation in the core monsoon region of India is attributed to these synoptic scale disturbances. These systems usually form over the warm waters of Bay of Bengal (BoB) and propagate northwest ward along the monsoon trough towards the western states Rajasthan/Gujarat. Monsoon LPS are attributed to produce around 60% of monsoon precipitation over core monsoon region of India and about 40% of monsoon precipitation for the country. Many extreme precipitation events and consequent floods in the Indian subcontinent are also attributed to LPS. At the Indian Institute of Science, Bengaluru, India, we study the statistics or climatology of these systems in terms of their frequency, intensity, genesis and tracks in observational records and model (NCAR CESM) simulations (Figure 3). The change in these statistics for boundary condition changes such as alternation in topographical features such as the Himalayas, the Western Ghats, greenhouse gas changes and solar geoengineering are also assessed using climate models.
Publication:
Tresa Mary Thomas, G. Bala, VV Srinivas, 2022: CESM simulation of monsoon low pressure systems over India, International Journal of Climatology,
http://doi.org/10.1002/joc.7571
Figure 3 (LPS genesis and track densities): LPS genesis density (i.e., number of genesis locations per year within 500 km radius of a location; top panels) and track density in the ERA5 reanalysis data (right panels) over a 37-year period (1979-2015) and in the present-day control simulation of the NCAR CESM2.1.3 model over a 33-year period. Most LPS form over the northern Bay of Bengal and move northwest wards. The thick black line in the bottom panels denotes the median track in the respective cases. A southward latitudinal shift can be noticed in the genesis and track density and the median track locations in the CESM simulations compared to ERA5 reanalysis.
4. Carbon cycle research
In the industrial era, anthropogenic activities have led to an increase in the concentration of atmospheric CO2 and other greenhouse gases, resulting in global warming. As CO2 is the dominant driver of current climate change, it is important to understand the sources/sinks and the ultimate fate of anthropogenic CO2 emissions. At CAOS, we use Earth System Models (ESMs) to study the carbon cycle and climate processes involved in determining the fate of CO2 emissions and the evolution atmospheric CO2 concentration on decadal to millennial timescales.
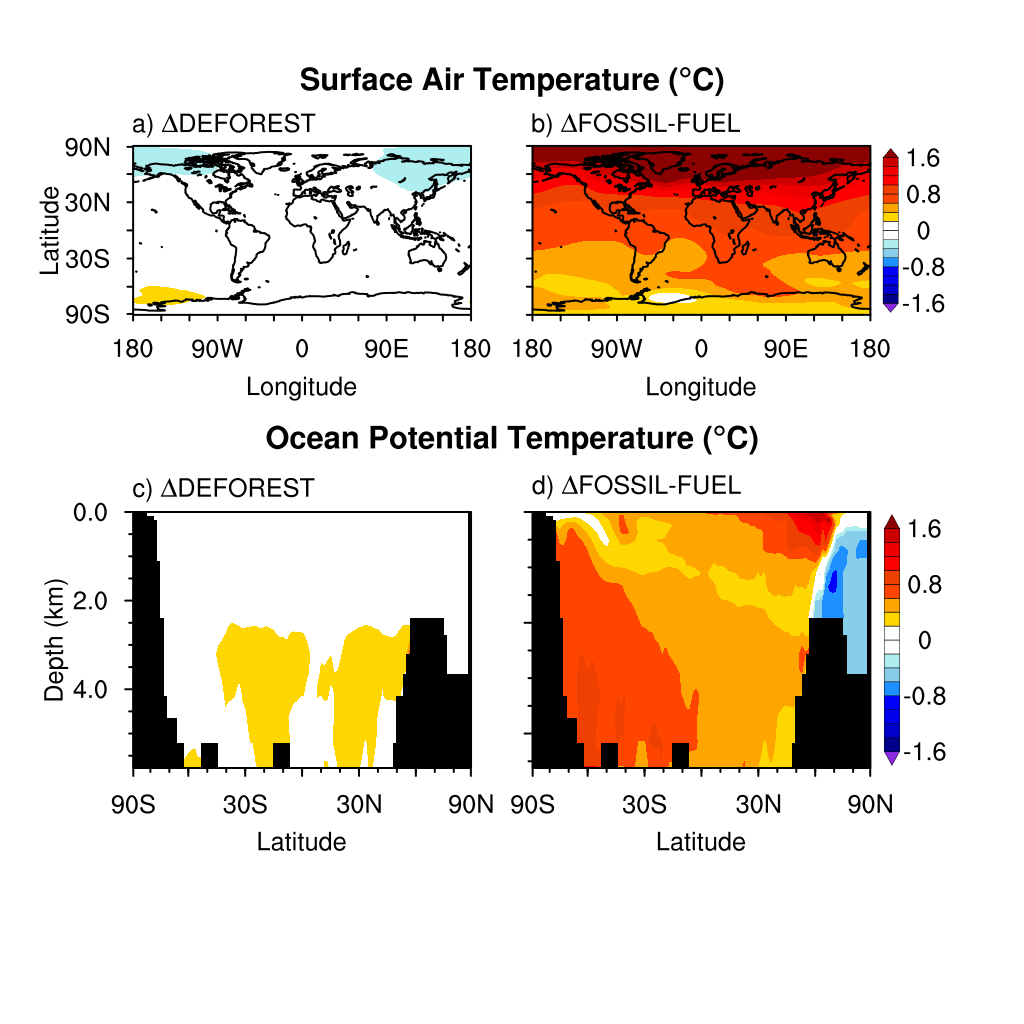
In a recent study (2022), we evaluated how the response of climate system to equal amounts (600 PgC) of fossil fuel and LULCC emissions differ, using a set of highly idealized abrupt fossil fuel emissions and global deforestation simulations. In the fossil fuel simulations, after 1000 years, about 20% of the initial atmospheric CO2 concentration perturbation remains in the atmosphere and the climate is about 1°C warmer compared to preindustrial state (Figure 4). In contrast, in the case of deforestation with regrowth, after 1000 years, atmospheric CO2 concentration returns close to preindustrial values as deforested land recovers its carbon over the decades and centuries in the absence of further human intervention. These results highlight the differences in the degree of long-term commitment associated with fossil-fuel versus deforestation emissions.
Figure (4 Climate and carbon cycle response to CO2 emissions from fossil fuel use and deforestation are different): The spatial pattern of the change in surface air temperature (SAT) in the a) DEFORESTION and b) FOSSIL-FUEL emission simulations averaged over the last 100 years of 1000-year simulations relative to the preindustrial state. Abrupt CO2 emissions of 600 PgC were introduced in both the simulations which use the University of Victoria Earth System Climate Model (UVic ESCM). The panels c) and d) are same as a) and b) respectively, but for zonally averaged ocean potential temperatures at different depths of the ocean. In the DEFORESTION simulation, the changes in SAT are either zero or little, while in the FOSSIL-FUEL emission case, SAT change is larger and positive almost everywhere. Similar to the changes in SAT, the changes in ocean temperature are either zero or little in the DEFORESTION case almost everywhere, while they are larger and positive in the FOSSIL-FUEL emission case everywhere except in the northern hemisphere high latitudes.
5. Stable isotopes of water in Indian monsoon precipitation
Stable isotopes of water, particularly δ18O, are used as proxies to reconstruct the past Indian monsoon precipitation based on the climate-dependent fractionation of the water molecule. Further, an identification of the sources of water vapor could help to understand the influence of monsoonal circulation on the δ18O values in precipitation. At the Indian Institute of Science, Bengaluru, India, we recently used the isotope-enabled version of the NCAR CESM modelling framework to estimate the contributions of oceanic and terrestrial water vapor sources to two major precipitation seasons in India—the Southwest monsoon and the Northeast monsoon, and their effects on the δ18O in precipitation (δ18Op). This work involved collaboration with scientists at NCAR.
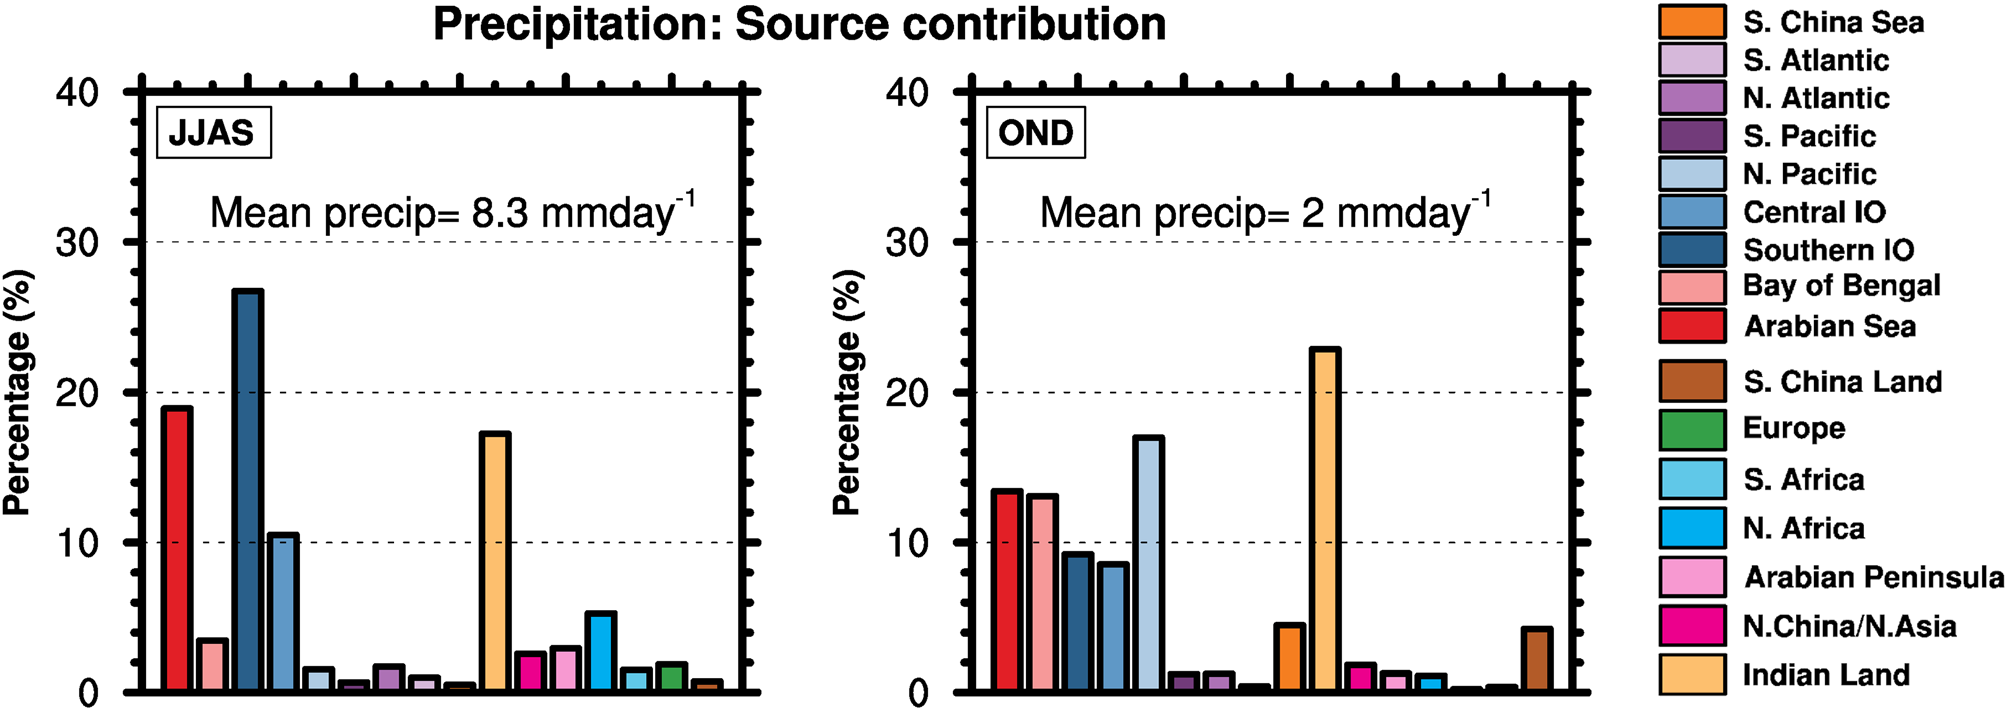
In our recent work, published in Nature Scientific Report, we found that the two monsoon seasons in India have different dominant sources of water vapor because of the reversal in atmospheric circulation. While the Indian Ocean regions, Arabian Sea, and recycling are the major sources for the Southwest monsoon precipitation during summers, North Pacific Ocean and recycling are the two crucial sources of monsoon precipitation during the Northeast monsoon in the winters (Figure 5). The δ18Op of the Southwest monsoon precipitation is determined by contributions from the Indian Ocean sources and recycling. Though the Northeast monsoon brings relatively much smaller precipitation to India, more negative δ18Op values are simulated due to larger negative δ18Op contributions from the North Pacific. Our results imply that climate model simulations of atmospheric circulation, water vapor sources and δ18O can help to understand paleo monsoon circulations.
Publication:
Thejna Tharammal, G. Bala, and Jesse Nusbaumer, 2023: Sources of Water Vapor and their Effects on Water Isotopes in Precipitation in the Indian Monsoon Region: A Model-Based Assessment, Nature Scientific Reports, 13 (1), 708,
https://doi.org/10.1038/s41598-023-27905-9
Figure 5. (Water vapor sources for the Indian summer and winter monsoon precipitation): Relative contributions (in %) of the regional sources to the mean seasonal precipitation in the Indian domain. Left) regional source contributions to the Southwest monsoon precipitation in the summer season, Right) same as left, but for the Northeast monsoon precipitation in the winter season. Indian domain means of precipitation rates for both seasons are shown inside the panels. The figures were created using NCAR Command Language (NCL) Version 6.6.2 (http://www.ncl.ucar.edu/).